The fluid inclusion is the original geological fluid enclosed in the mineral lattice defects and the cave nest.
Commonly used
Reveal mineralization conditions, fluid composition and material sources of diagenesis in different periods
. As an analogy of natural inclusions, artificial inclusions are an effective way to solve many problems related to fluid inclusions. As a standard for various instruments and test methods for verification application and natural inclusion analysis, synthetic fluid inclusions are also More and more widely recognized. At present, the more mature artificial inclusion technology is to heal the mineral crack formation in the aqueous environment, H2O-CO2
(±NaCl) system is the most common fluid encapsulation system
one
[1-4]
.
Raman
scattering
The effect is an inelastic scattering caused by molecular and lattice vibrations.
It has the advantages of rich information, high analytical efficiency, low sample consumption, and non-invasiveness. Laser micro-Raman spectroscopy is a high-tech integrating spectroscopy, chemometrics, detection technology and computer technology. Laser micro-confocal Raman spectroscopy has the following advantages in the field of fluid inclusions: 1) no damage detection, no contact, maximum sample performance; 2) high sensitivity, rich spectral peak information; 3) Raman spectroscopy The high temperature properties of the inclusions can be detected in situ, and the phase equilibrium of the internal materials, the dissolution, precipitation and migration of the minerals, and the partial melting of the deep rocks can be explored.
In this paper, Raman spectroscopy is used to test synthetic fluid inclusions and compare them with natural inclusions to verify the feasibility of Raman in this field.
Current status of inclusion Raman spectroscopy
The fluid inclusions contain trace amounts of the original ore-forming fluid. Since it is formed, there is no addition of foreign substances and the outflow of its own substances. It is a relatively closed system.
,
Therefore, fluid inclusions can be studied as the original ore-forming fluid with reliable originality. The formation pressure of fluid inclusions is of great significance for studying oil and gas migration, accumulation history and tectonic movement history. How to accurately obtain the pressure value of inclusions has always been a topic that many scholars pay attention to and continue to explore. At present, commonly used methods for measuring the pressure of fluid inclusions include isotherm diagram method, salinity-temperature method, sodium chloride-water solution inclusion density and isovolumetric method, and PVT simulation method.
[1-5]
.
Rosasco et al. (1975) first published Raman spectroscopy results for natural fluid inclusions. Subsequently, Beny et al. (1982) and Tourary et al. (1985) published comprehensive fluid system and Raman spectroscopy methods, respectively. Result
[6]
These reports not only succumbed to the possibility of Raman's application in the field of inclusions, but also pointed out the path for quantitative analysis of fluid inclusions for effective cross-sectional area. Pasteris et al. (1988) systematically discussed the limitations of Raman instruments and optimized analytical conditions, providing a potential for Raman's broad application.
In China, Huang Weilin et al. (1990), Xu Peicang et al. (1996) used Raman spectroscopy for fluid inclusion analysis and discussed quantitative analysis methods in detail.
Laser Raman detection principle
Raman
scattering
The effect is an inelastic scattering caused by molecular and lattice vibrations.
Has nearly 90 years of research and application history. In 1923, A. Smekal theoretically predicted the existence of Raman spectroscopy. 19
28
In the year, Indian physicist Raman discovered the phenomenon of the change of the scattered light frequency and explained it with the molecular vibrational energy level and the virtual energy level, which is called Raman scattering. Simultaneously,
Landberg
,
Manderstam
as well as
Cabannes
,
Rocard
Raman scattering results were observed
.
Raman spectroscopy has the advantages of rich information, high analytical efficiency, low sample consumption, non-invasiveness, etc., and has been widely applied to various fields, such as biotechnology, mineralogy, environmental monitoring, food and beverage, forensic science, medicine. Wait.
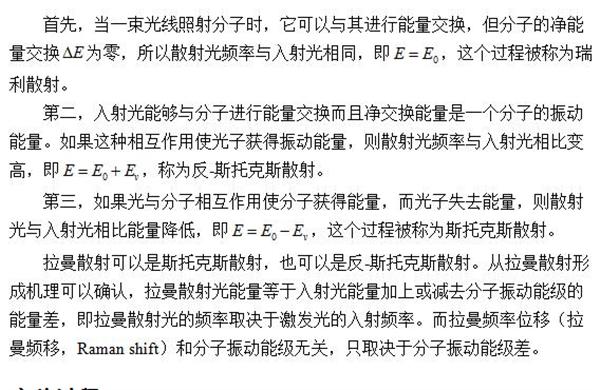
Raman spectroscopy is caused by factors such as lattice vibration, charge density fluctuation, spin density fluctuation, electronic transition, and their coupling. When the sample is excited by a light source of a certain frequency, elastic and inelastic scattering phenomena are generated. Most molecules undergo elastic collision, the frequency of photons does not change, or there is no change in wavelength and energy, no energy transfer; a small part of molecules undergo inelastic collision, photons may be lost or increased due to excitation or inactivation of molecular vibration Some energy, frequency changes. When the incident light wave propagates and spreads in the molecule, the following three types of phenomena may occur, as shown in Figure 1:

Figure 1 Raman and Rayleigh scattering energy levels

The Raman scattering can be Stokes scattering or anti-Stokes scattering. From the Raman scattering formation mechanism, it can be confirmed that the Raman scattered light energy is equal to the incident light energy plus or minus the energy difference of the molecular vibrational energy level, that is, the frequency of the Raman scattered light depends on the incident frequency of the excitation light. The Raman shift (Raman shift) is independent of the molecular vibrational level and depends only on the molecular vibrational level difference.
experiment procedure
Experimental sample: A fluid inclusion sample prepared by a fusion silica capillary technique with a diameter of 8-12 mm, a set of natural fluid inclusions.
The minimum fluid inclusion that can be analyzed by Raman depends on a number of factors, including the nature of the microscope system, the laser source, the type of detector of the spectrometer, the density of the fluid, the depth of the inclusion in the sample, the background signal of the substrate, and the like. for
Reduce sample test time
,
Sample preparation has the following requirements:
1) The best choice is to obtain the inclusion of microscopic temperature data, so the sample needs to be ground on both sides and the thickness is 50-200um. It is recommended to use beeswax.
2) High reflectivity minerals (such as calcite) can cause double images in the deep, which makes it difficult to find samples.
3
When testing samples, try to detect samples close to the surface, such as N
2
The fluid, with an optimum depth of 30-70 um, can obtain the strongest Raman signal at this depth and avoid nitrogen interference in the air between the objective lens and the sample.
However, confocal Raman spectrometers generally do not have such background interference problems.
Therefore, this type of instrument was selected for this test.
4
)
Trying to analyze inclusions close to the surface is an important principle for Raman spectroscopy of fluid inclusions.
because
Small inclusions near the surface of the sample are likely to be stronger than the Raman signal of the large inclusions in the deep.
In addition,
There are three factors that can cause fluorescence, including surfaces, matrix minerals, and fluid inclusions.
Therefore, the test conditions should be fully considered before the experiment to avoid the interference of fluorescence.
Experimental equipment: Beijing Zhuoli Hanguang Instrument Co., Ltd. independently developed and designed
Finder Vista
Microscopic confocal Raman spectrometer system with high performance
CCD
Backscatter detector; laser wavelength is
532nm
, intensity 10mw; 1800g/mm grating, resolution <0.9cm
-1
Slit width is
100um
, the integration time is
20s
, scan size is 10
0
X objective lens.
experiment analysis
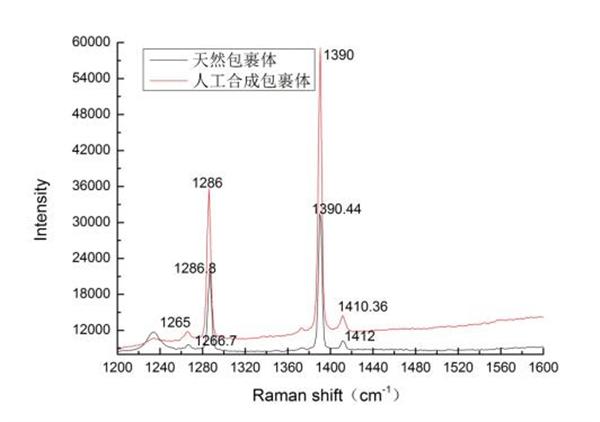
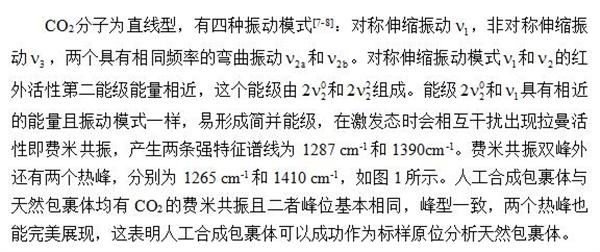
The Raman spectrum of natural inclusions and synthetic inclusions is shown in Figure 2.

figure 2
Raman spectra of natural inclusions and synthetic inclusions
The experimental inclusion is CO
2
Gas inclusions can provide important information for studying mineralization, hydrocarbon migration and accumulation, geological fluid evolution and tectonic dynamics.

in conclusion
Raman spectroscopy analysis of capillary samples has the advantages of simplicity, directness, speed and precision.
,
Raman spectrometer
Detection
Capillary samples do not interfere with the signal of the fluid in the sample,
Simultaneously,
Due to the macroscopic size of the capillary, the Raman spectrometer laser beam not only accurately focuses on each phase, but also acquires a good Raman signal.
. Synthetic inclusions can clearly and perfectly interpret the phase change process and characteristics, and lay a foundation for the accurate observation of natural inclusions. Carbon dioxide synthetic inclusions can be used as standard samples for verification and natural inclusion analysis. Standards for instruments and test methods, and provide technical feasibility and practicality for Raman spectroscopy of natural fluid inclusions.
references
[1] Li Jiajia, Li Rongxi, Liu Haiqing. Research progress in the determination of fluid inclusion pressure by laser Raman spectroscopy [J]. Physical and Chemical Testing - Chemistry, 2016, 52(7): 859-864 .
[3] Ni Pei, Ding Junying, I-MingChou et al. A new type of artificial "fluid inclusion": fusion silica capillary technology [J]. Geoscience Frontiers, 2011, 18(5): 132-139.
[4] Chen Yong, ERNSTA A. J. Burke. Principles, methods, existing problems and future research directions of laser inclusion Raman spectroscopy for fluid inclusions [J]. Geological Review, 2009, 55(6): 851-861.
[5] Chen Jinyang, Zheng Haifei, Zeng Yushan et al. In situ analysis of fluids at high temperatures using inclusions as cavities[J]. SPECTROSCOPY AND SPECTRAL ANALYSIS, 2003, 23(4): 726-729.
[6] Chen Yong. Principles, methods, existing problems and future research directions of laser inclusion Raman spectroscopy for fluid inclusions [J]. Geological Review, 2009, 55(6): 851-860.
[7] Ding Junying, Ni Pei, Guan Shenjin. H
2
O-CO
2
In-situ Micro-laser Raman Spectroscopy Study of System Fusion Silica Capillary Samples[J]. Geoscience, 2011, 18(5): 140-146.
[8] Li Jiajia, Li Rongxi, understand, etc. Microscopic laser Raman quantitative analysis of CO
2
Study on Gas Carbon Isotope Composition Method[J]. SPECTROSCOPY AND SPECTRAL ANALYSIS, 2016, 36(8): 2391-2398.
Onlyrelx Energy5000 disposable vape pen is portable and fashion disposable electronic cigarette, disposable ecigs pen are trending featured vape pen for vapors as it's safety and easy to use. Disposable vape pod,disposable vape, wholesale vape,vape wholesale,vape pen manufacturer and supplier.disposable vape pen,disposable electronic cigarette,disposable ecigs pen,disposable ecigs stick,disposable e-cigs pen,disposable vape factory,disposable vape pod,disposable vape device,vape pen,vape stick, vape wholesale,wholesale vape,customized dispsoable vape pen,customized vape pen,OEM&ODM disposable ecigs pen,disposable electronic cigarette wholesale, wholesale disposable electronic cigarette,distribute vape pen,vape pen distribute,high quality vape pen,high quality vape pod.
Onlyrelx Energy5000,Customized Vape Brand,Customized Vape Pen,Custom Made Vape Pen
Shenzhen Onlyrelx Technology Co.,Ltd , https://www.onlyrelxtech.com