Through theoretical analysis and experimental verification, it can be seen that the information returned by the first and second layers mainly includes road surface, lane line, a small number of obstacles and boundary data; the three or four layers mainly return road boundaries, obstacles and a small amount of road surface information, so the characteristic seed points In the extraction stage, it is necessary to analyze the radar data of one or two layers. The biggest interference in the part of the data for the lane line detection lies in the road surface. The key point of extracting the lane line seed point feature is to separate the lane line features and the road surface features.
Lane system detection based on vision system has many defectsFirst, the vision system is sensitive to background light, such as strong sunlight, and the lane lines are split into pieces by light, making it impossible to extract lane lines.
Secondly, the visual system needs the integrity of the lane line. Some roads that have been in disrepair for a long time, the lane markings are not obvious, incomplete, and some roads that have just been opened for several years are also true.
Third, the visual system needs to have a uniform format of lane lines, which is especially important for systems that recognize lane lines according to the model library. Some lane lines are very strange, such as blue-colored lane lines, narrow lane lines, and model libraries must travel. The country will include these strange lanes in order to ensure smooth detection.
Again, the vision system cannot correspond to low-light environments, especially nights without street lights. Generally, LKW requires a speed of more than 72 kilometers to start. One of the reasons is that people will not easily change lanes when the speed is high. Another reason is that a lower speed means that the sampling point of the vision system is insufficient, and the accuracy of the fitted lane line is Lower. The effective distance of Lidar is generally 4-5 times that of the visual system. There are more effective sampling points. When the vehicle speed is lower, the detection accuracy is much higher than that of the vision system.
Finally, if the surface of the lane line is covered by water, the vision system will be completely ineffective. The biggest advantage of the vision system is its low cost. Therefore, since 2008, the academic community has seldom studied the lane detection based on the vision system, and instead uses the lidar to detect the lane line. Lidar can solve all the above problems, including the lane line covered by water, and the lidar can pass through 70. The water depth of the rice.
The only drawback of Lidar is that the cost is too high.
Lane line detection based on radar scanning point densityThe early lidar detection lane line is a lane line detection method based on the radar scanning point density. The method obtains the coordinates of the radar scanning point and converts it into a raster image, and maps the raster image with the original data, which may be a direct coordinate raster map. It can be a polar coordinate raster map.
According to the post-processing needs, the polar coordinate grid map is directly used for lane line identification, that is, the grid with multiple point mappings is considered as the lane line point. The identification method has high requirements for feature extraction and is subject to The distance is seriously affected, because the closer the polar coordinate grid is, the higher the accuracy of the grid is, the higher the accuracy of the lane line recognition is. The farther the distance is, the lower the grid precision is, the lower the accuracy of identifying the lane line is, and then the point in the grid map is used. The density is extracted from the lane line.
For the determination of the point density, the histogram statistics can be used. The density of the points through the histogram is quick and intuitive and easy to understand. Since the detection method based on the scanning point density does not have a complicated intermediate process, the real-time performance is high, and it is favored by everyone in the rapid detection.
However, this method only obtains the position information of the scanning point. For the other information of the radar feedback, there is no further analysis. It is easy to mix some road information similar to the lane line scanning point density into the lane line detection result; or in the lane line and other When obstacles approach or coincide, it is impossible to distinguish between obstacles and lane lines, and they can only be retained or rejected as a whole.
Therefore, the anti-interference ability of this method is poor, and it is prone to false detection. This method is currently infrequently used.
Four methods for detecting lane lines by lidarAt present, there are four main methods for detecting radar lanes by laser radar:
· Based on the lidar echo width;
· Based on the grayscale map formed by the laser radar reflection intensity information, or according to the intensity information and the elevation information, filtering out the invalid information;
· Lidar SLAM cooperates with high-precision maps to detect not only lane lines but also self-vehicle positioning;
· Lidar can acquire different characteristics of roadside height information or physical reflection information, and first detect the roadside. Because the road width is known, the lane line position is calculated according to the distance. This method cannot be used for roads where the road edge and the road height differ by less than 3 cm.
The latter three methods require multi-line lidar, and at least 16-line lidar. The former can use 4-wire or single-line lidar. Considering that the Audi A8 has started to use 4-line laser radar, the 4-line laser radar has entered the practical stage.
Of course, these four methods can also be mixed.
Lane line detection two stepsLane line detection is basically divided into two parts: extracting geometric or physical features, and fitting the lane lines with discrete data. Whether it is vision or lidar, the lane line is usually fitted by least squares.
Discrete data fitting lane lineIbeo is the most suitable laser radar for the first method. Ibeo's laser radar features three echoes. Each point of the laser returns three echoes, and the return information can more reliably restore the measured object, while accurately analyzing the relevant object data, and can identify data of unrelated objects such as rain, fog, and snow.
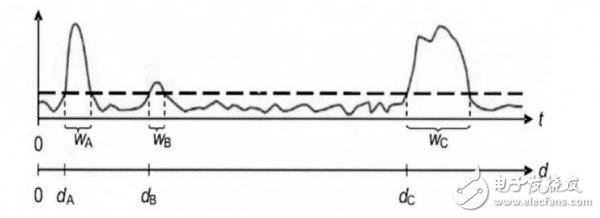
As shown, where W is the echo pulse width and d is the distance of the scan target. Reflectivity, as an intrinsic property of an object, is well influenced by the material, color, etc. of the object, and can reflect the characteristics of the object and different colors.
The reflectivity of the density object has a certain difference. The reflectivity of the object determines the pulse width characteristic of the Ibeo echo. The road surface and the lane line have obvious differences, so the difference can be distinguished by the difference of the echo pulse width.
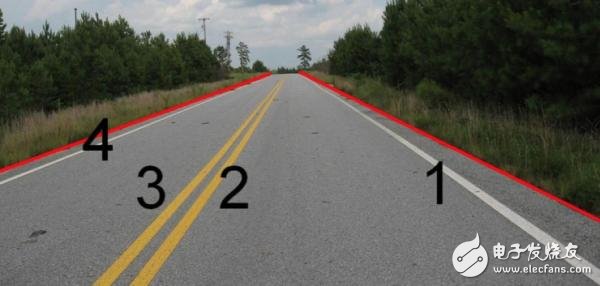
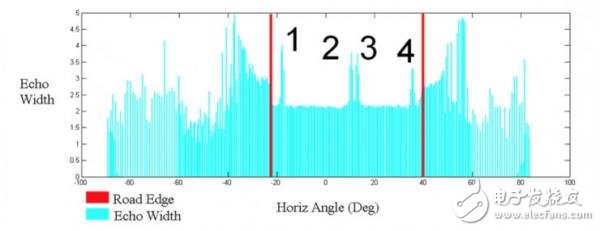
Obviously, the echo width of the road surface is about 2 meters, and the echo width of the lane line is about 4 meters.
According to the characteristics of Ibeo, the scanning angle in the vertical direction is 3.2 degrees, which is divided into four layers of scanning, that is, 0.8 degrees per layer. In the case of Ibeo horizontal installation, and considering the actual situation, the height of the Ibeo is affected by the vehicle body. Restricted, the lower two layers (one and two layers) mainly return information on the road surface, while the upper two layers (three and four layers) mainly return road information with a certain height.
According to the characteristics of the laser radar, it is known that the laser beam is scanned into the object and the echo is generated immediately. The scanning distance of one or two layers is much smaller than that of the three or four layers.
Through theoretical analysis and experimental verification, it can be seen that the information returned by the first and second layers mainly includes road surface, lane line, a small number of obstacles and boundary data; the three or four layers mainly return road boundaries, obstacles and a small amount of road surface information, so the characteristic seed points In the extraction stage, it is necessary to analyze the radar data of one or two layers. The biggest interference in the part of the data for the lane line detection lies in the road surface. The key point of extracting the lane line seed point feature is to separate the lane line features and the road surface features.
Least squares fitting lane lineThe segmentation threshold of the road surface and the lane line is found by the minimum intra-class variance algorithm. The error analysis principle is used to eliminate the coarse error in the range of the lane line set, that is, the interference information is removed, and the lane line feature seed point is extracted. Then fit into the lane line.
The minimum intraclass variance is an adaptive threshold method and a fuzzy clustering method. The basic idea is to use a threshold to divide the overall data into two classes, because the variance is a measure of whether the numerical distribution is uniform. The smaller the internal variance of the two classes, the smaller the difference between each class, then the two classes. The difference between them is greater.
If there is a threshold such that the intra-class variance is the smallest, then the threshold is the best value for dividing the two categories. Using the optimal threshold division means that the probability of dividing the two types of deviation is the smallest.
The minimum intra-class variance algorithm is used to model the segmentation lane feature and the pavement feature by echo pulse width, and the maximum interference of lane line feature extraction is eliminated. Statistical analysis of the echo pulse width and division of the pulse width level, because the direct use of the pulse width value is not conducive to statistics, using the pulse width average area division, that is, the pulse width level, counting the number of points in each level, thereby obtaining the echo Pulse width distribution histogram. The interference value is then removed using a method such as fuzzy cluster analysis.
The least squares approximation solves the mathematical method of continuously optimizing close to the true value. It can easily obtain the unknown data by using the known data, and continuously optimizes the minimum sum of the squares of the error between the guaranteed data and the real data.
Using the least squares method to fit the curve is to continuously optimize and obtain a curve to best reflect the trend of the existing data points. The specific process is to use the known data points to optimize and obtain the best unknown data. The curve and ensure that the sum of the squares of the distances from the existing data points to the curve is minimal.
That is to say, the curve fitting does not require the approximate curve to pass all the data points, only the known data points are not far from the curve, that is, this curve can reflect the overall distribution of the data points, and does not appear For large local fluctuations, the sum of the squares of the deviations between the known data and the curve is minimized to effectively control the fluctuations.
In short, the least squares fit is to find the best function match for the data by using the sum of the squares of the minimized errors.
Based on laser radar reflection intensity information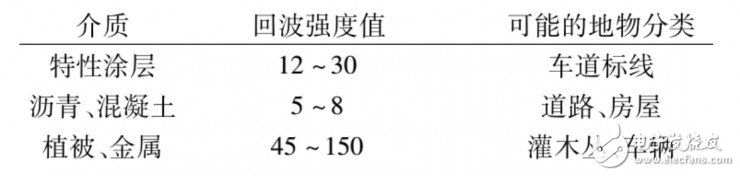
According to the detection of the lane line value of the reflection intensity value, the road and the lane line can be easily distinguished in the number of environmental point clouds around the road acquired by the onboard laser radar.
Specifically, it can be regarded as a local mean change point model in the 3D point cloud data of the road surrounding environment acquired by the vehicle laser radar. The echo intensity value in the travelable area collected by each laser layer is a set of output sequences, and its echo intensity. The point at which the value changes is the set of lane marking points required.
It is now only necessary to detect whether there is a change point in the output sequence of the echo intensity value in the travelable area collected by each laser layer, and if so, mark and extract these change points. The T coordinate value in the mass point cloud data in the region of interest of the smart car acquired by the vehicle radar has a certain elevation characteristic for filtering, and the obstacle area is determined by determining the travelable area and then removing the obstacle value similar to the echo value of the lane marking.
Since the point cloud data of the surrounding environment acquired by the onboard laser radar is stored hierarchically, the distance between two adjacent points of the surrounding point cloud data acquired by different laser layers is related to the distance from the origin of the radar coordinate system.
Automotive Diagnostic Connectors And Cables
We make OBD connector with terminal by ourselves, soldering type and crimping type are both available. Such as 16pin obd connector. OBD1, OB2, J1939, J1708, J1962, etc. Also molded by different type, straight type or right-angle type. The OBD connector cables used for Audi, Honda, Toyota, BWM, etc. We have wide range of materials source , also we can support customers to make a customized one to replace the original ones.
Automotive Diagnostic Connectors And Cables,Obd Connectors,Reliable OBD Connector,Black OBD Connector,OBD Diagnostic Cable,OBD2 Connectors
ETOP WIREHARNESS LIMITED , https://www.wireharnessetop.com