A few days ago, several researchers from Germany and France published an article on Oxford Academic titled Man against machine: diagnostic performance of a deep learning convolutional neural network for dermoscopic melanoma recognition in comparison to 58 dermatologists. The long title tells us that this is another story that makes people compete with machines to see who can identify skin melanoma with higher accuracy. The final result shows that the deep learning model is better than human doctors.
But today, Australian medical doctor and radiologist Luke Oakden-Rayner questioned the rigor of the paper on Twitter, thinking that the conclusion was too sloppy and underestimated human performance. Which of the two parties is more reasonable? Let’s take a look at what this paper says.
CNN vs human
In the past few decades, melanoma has become a major challenge threatening public safety. The continuously rising morbidity and mortality rates have made early detection and prevention the key to diagnosis. A number of analyses show that the application of dermoscopy has greatly improved the diagnostic accuracy. However, the training received by each physician is different, and the level is also uneven. The current average diagnosis accuracy of melanoma is less than 80%.
In recent years, some automatic computer image analysis technologies have appeared, intended to help improve the accuracy and efficiency of medical diagnosis. But these methods have limitations. They all use human-prescribed diagnostic criteria for dermoscopy to make judgments, such as whether there are multiple colors, special shapes such as stripes and nodules, or irregular vascular structures.
In 2017, Esteva et al. published a paper announcing that they had created a deep learning model based on convolutional neural networks that can classify pictures. CNN does not need to be restricted by human standards. It can decompose digital pictures into pixel levels. Level and finally make a diagnosis. This essay is also regarded as a revolutionary work.
The purpose of the German and French researchers this time is to train, verify, and test a deep learning CNN to make it diagnose and classify dermoscopic imaging, determine whether it is a melanoma or a benign mole, and compare the results with 58 dermatologists. Compare.
specific method
Google's Inception v4 CNN architecture is trained and verified using dermoscopy images and corresponding diagnosis results. In the horizontal human doctor verification, there is a test set consisting of 100 pictures (the first step is only to observe with a dermoscopy, and the second step will add diagnostic information and pictures). The main criteria for measuring the output are sensitivity, specificity, and the comparison between the AUC value of the ROC curve of the CNN's diagnostic classification of the lesion and the 58 human doctors in the reader study.
The secondary evaluation indicators include the diagnostic performance of the dermatologist in management decision-making and the difference in diagnosis at two different stages. In addition, the performance of CNN will be compared with the top five algorithms in the 2016 International Symposium on Biomedical Imaging (ISBI) Challenge.
compare results
In the performance of the first stage of human doctors, their scores were close to the average level. In the classification of lesions, the sensitivity was 86.6% (±9.3%) and the specificity was 71.3% (±11.2%). After adding more information in the second stage, the sensitivity rose to 88.9% (±9.6%, P=0.19), and the specificity rose to 75.7% (±11.7%, P<0.05).
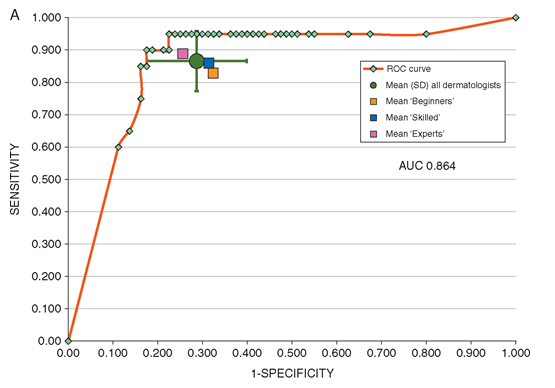
In the first stage of CNN's ROC curve, the specificity is 82.5% higher than that of human doctors. The ROC AUC score of CNN is also higher than the average ROC area of ​​doctors, which is 0.86 vs 0.79, P<0.01. CNN's final score is close to the top three algorithm scores in the 2016 ISBI Challenge.
in conclusion
In a team of 58 dermatologists including 30 experts, this is the first time that we have compared CNN with humans. In most cases, CNN performs better than human doctors. The researcher does not deny the doctor's experience and efforts, but believes that with the help of CNN image classification technology, the diagnosis rate will be higher.
AI won?
After this paper was published, it received many big V forwards, including Yann LeCun, the father of convolutional networks.
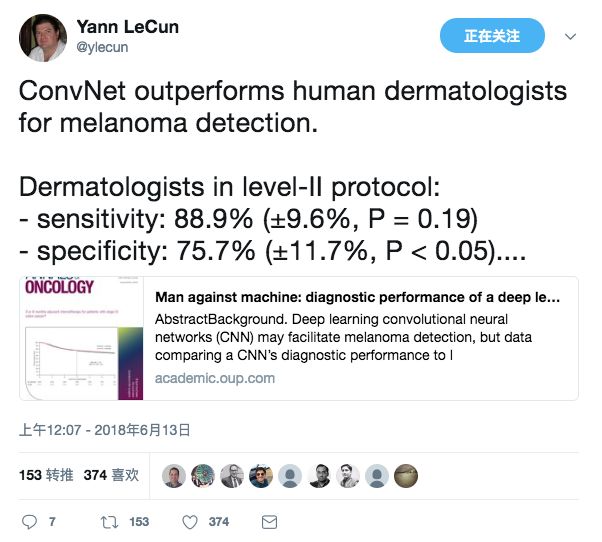
Although only repeating the comparison results, LeCun's reposting also received more than 300 likes.
At the same time, the Washington Post, medical websites and other media have also reported this result, claiming that "AI defeated humans," but some people questioned the statistical methods.
The paper is good, but flawed
Today, Luke Oakden-Rayner, a radiologist and medical doctor, said on Twitter: This paper is flawed! Simply put, he believes that the researcher underestimated the performance of human doctors. Lun Zhijun compiled the specific reasons as follows:
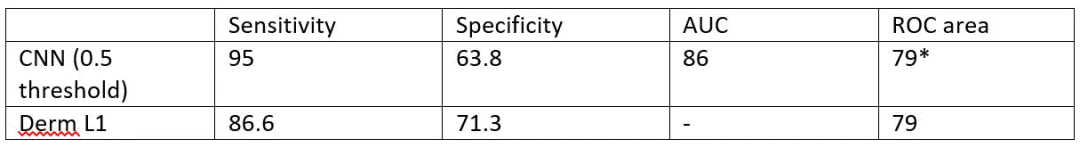
I think that researchers use two different indicators when comparing humans and machines! For machines, AUC is used, and for humans, the average sensitivity and specificity derived from the "ROC area" are used. In addition to the different indicators, the "ROC area" as a whole is lower than the AUC. In fact, the better the dermatologist performs, the more it deviates from the assumed AUC.
According to the data of the paper, we can also calculate the "ROC area" of the model. The result is as follows, which is the same as the human score of 79.
In terms of specificity, the defects of contrast are even less noticeable. Expert doctors are distributed on the ROC curve, so the average sensitivity and specificity put the average doctors in the curve, and the model is still tested on the curve. Again, humans are underestimated. The following is an example of ROC curve, the pink point is the average score.
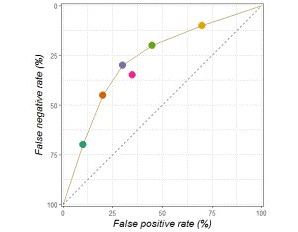
In addition, I am not sure whether the researcher has chosen the appropriate operating point (OP). In the process of comparing CNN and the doctor, the researcher seems to choose based on the test data. In their ROC, a reasonably selected OP greatly reduces the value of sensitivity and specificity. The purple dots in the picture below are their OPs, and the black dots are just close to the OP area.
Note that this ROC curve looks a bit strange, because the front part supports very few points, which means that this area lacks data support more than the upper part.
Finally, I don't know how they calculate the p-value. Given the operating point (average doctor's sensitivity), the researchers believe that the specificity is better at a p-value less than 0.01, but when the ROC number is on the curve, the confidence interval is 68%! Even if the interpretation of the graph is problematic, or there is a standard deviation of ±2, 95% of the value is still on the curve. I don't know what this has to do with p-value<0.01.
It should be noted that I do not completely deny this paper. I think this kind of discussion is meaningful. It's just that there are some places that I think are not rigorous, I hope my suggestions are useful.
Conclusion
At the end of the day, there are actually doubts about the way of comparison. Perhaps the researchers of the paper need to consider whether their statistical tests are fair, because just taking the average of the sensitivity and specificity of the doctors’ tests is not enough. This also reminds us not to be blindly superstitious when reading papers, to think diligently, and to ensure logical accuracy while discovering the highlights of the paper.
Privacy screen protector ,iphone privacy screen protector,screen protector privacy,iphone screen protector privacy
Guangdong magic Electronic Limited , https://www.magicmax.cc